How does `+` in ggplot work?
I am a big fan of ggplot2. As one of the most popular R packages, I’m clearly not alone. As well as making great plots, it’s given me a deeper concept of what a plot is, and to use ggplot terms, how data maps to a geom.
One of the most recognisable parts of the package is the concept of adding layers to plots. We’ll use the steak_survey dataset from the fivethirtyeight package. (Check out their website for some interesting data related stories!)
As shown below, the code to create a plot literally adds layers, using +. But how does the + work? We’re not adding numbers.. so what magic is going on? It seems so intuitive that it’s only on a second glance do we realise that this isn’t usual behaviour!
library(ggplot2)
library(fivethirtyeight)

steak <- fivethirtyeight::steak_survey

# Create example plot

ggplot(steak, aes(region, steak_prep, col = steak_prep)) + geom_jitter() + coord_flip()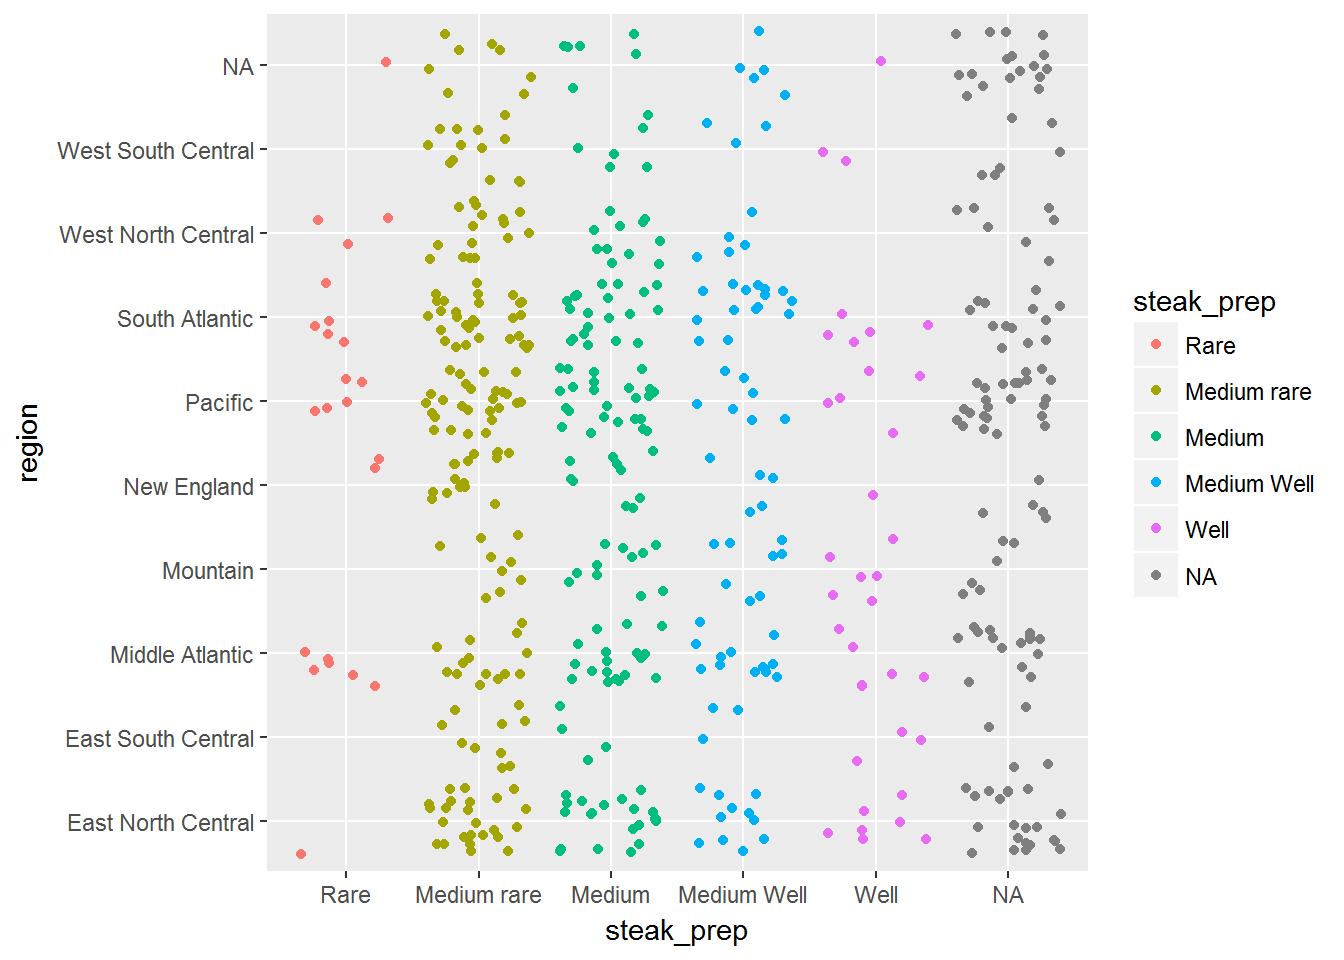
To get our answer, there are two parts to understand.
Part One - What exactly is +?
It seems pretty obvious. Everyone will recognise the + symbol from an early age. But what is it exactly in R?
1 + 2## [1] 3+ is in fact, just another function. The ability to perform x + y is syntactic sugar for the language. It’s much easier than typing it’s functional form, shown in the example below.
`+`(1, 2)## [1] 3class(`+`)## [1] "function"So when we call ggplot() + geom_jitter(), + is acting as a function like any other. We could recreate our above graph with the code below, as it’s equivalent (apart from the missing coord_flip. Sorry about those titles!).
`+`(ggplot(steak, aes(region, steak_prep, col = steak_prep)), geom_jitter())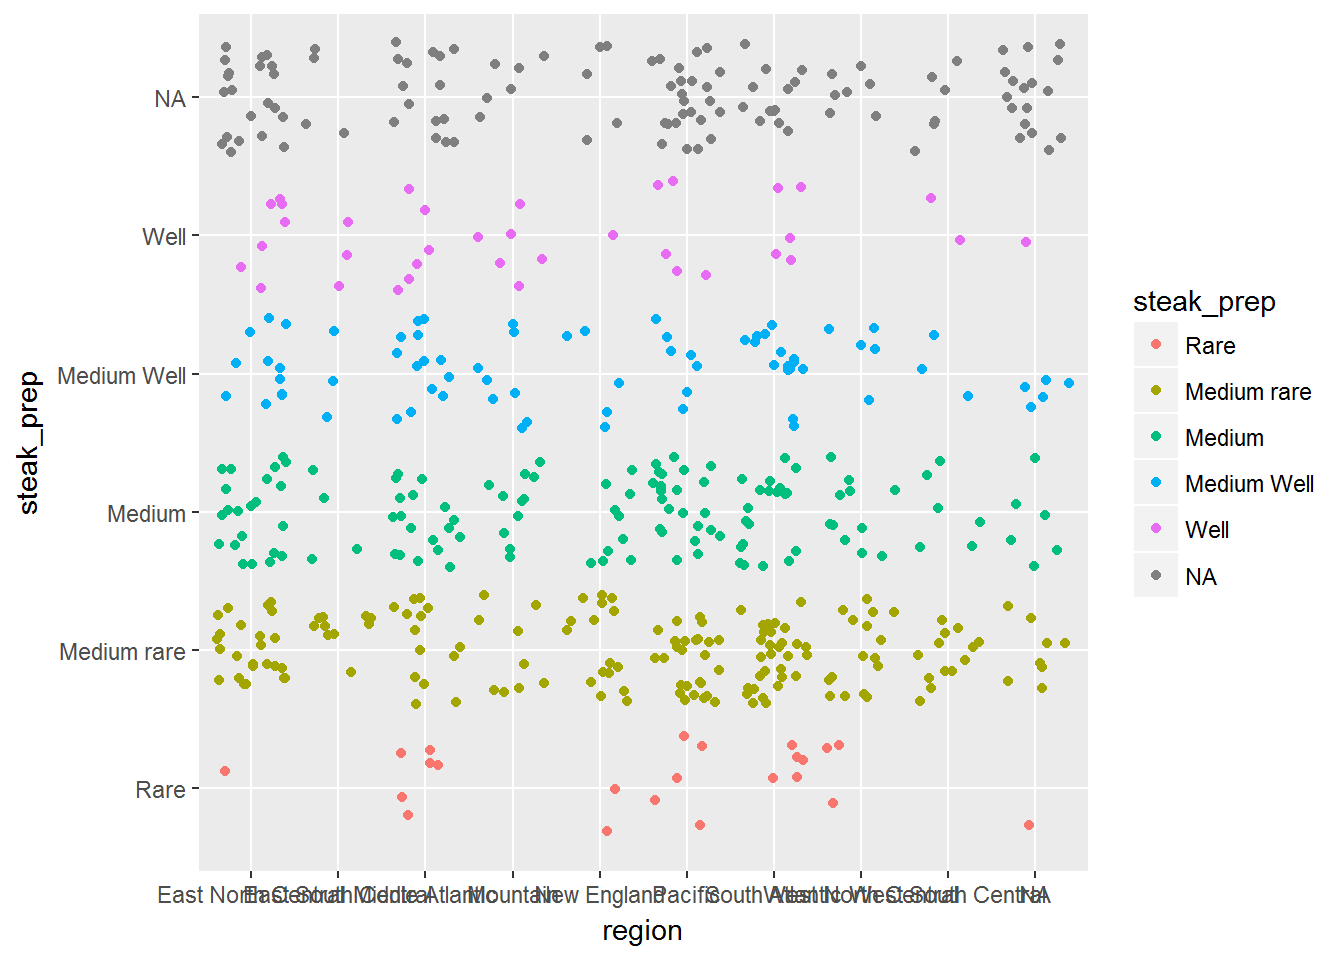
So that explains what + is, but how does R know what the sum of ggplot() + geom_jitter is?
Well, onto the next part!
Part Two - Generic Functions
To get out answer, we need to take a small detour.
Let’s take a look at print()
print("abcdef") # works as expected## [1] "abcdef"print(123) # Still works as expected## [1] 123Not very interesting so far, so let’s break it.
time <- Sys.time() # return current time
typeof(time) # double? But it's a date-time!?
## [1] "double"print(time) # This prints the date though..## [1] "2018-04-08 20:15:25 BST"As you can see, the time, is not strictly a time. It’s actually a double, counting the number of seconds since the Unix epoch. But when we print it, it returns a pretty date? Very odd.
print(as.numeric(time)) # That's what it actually is## [1] 1523214926So how does it know to print something else? The answer- Generic functions.
When you call print, a bit more goes on behind the scenes than you might initially realise. print is known as a generic method. Depending on the class of the object is it trying to print, a different print function will be called! You can see all of the methods for print using the methods() function.
typeof(print)## [1] "closure"class(print)## [1] "function"head(methods(print))## [1] "print.acf" "print.AES" "print.anova" "print.aov"
## [5] "print.aovlist" "print.ar"length(methods(print))## [1] 227When you print the time, it checks to see the class of the object. As our time object has the classes of POSIXct and POSIXt. It searches for the print.POSIXct() method, to nicely format out time. If it couldn’t find a print.POSIXct() method, it would look at the next class, POSIXt. If it still cannot find a method, it will use the print.default() method.
But what does this have to do with +?
You may have already made the leap, but as we discussed earlier, + is just another function. As such, we could assign it another method to it! In this case, it’s as below.
methods(`+`)## [1] +.Date +.gg* +.POSIXt
## see '?methods' for accessing help and source code# Note +.gg* - This is the method we are after!What exactly it does is the content of another post.
In summary, +() is a function. ggplot2 cleverly defines a new method for +(), which is then uses to allow the layering ability that we have in ggplot!
For a bit more information, check out the following
- The help page for the ggplot
+method. - For more about generic functions, check out Advanced R, by Hadley Wickham, who also authored the
ggplotpackage! - It appears that Hadley is making a example out of this in his 2nd edition of Adv-R (though I cannot find the section again)